

“If you want big profits, you want big trends, and to trade long-term.”
Ed Seykota
EQUITY MARKETS – INDICES
If things feel unclear right now, that’s because they are.
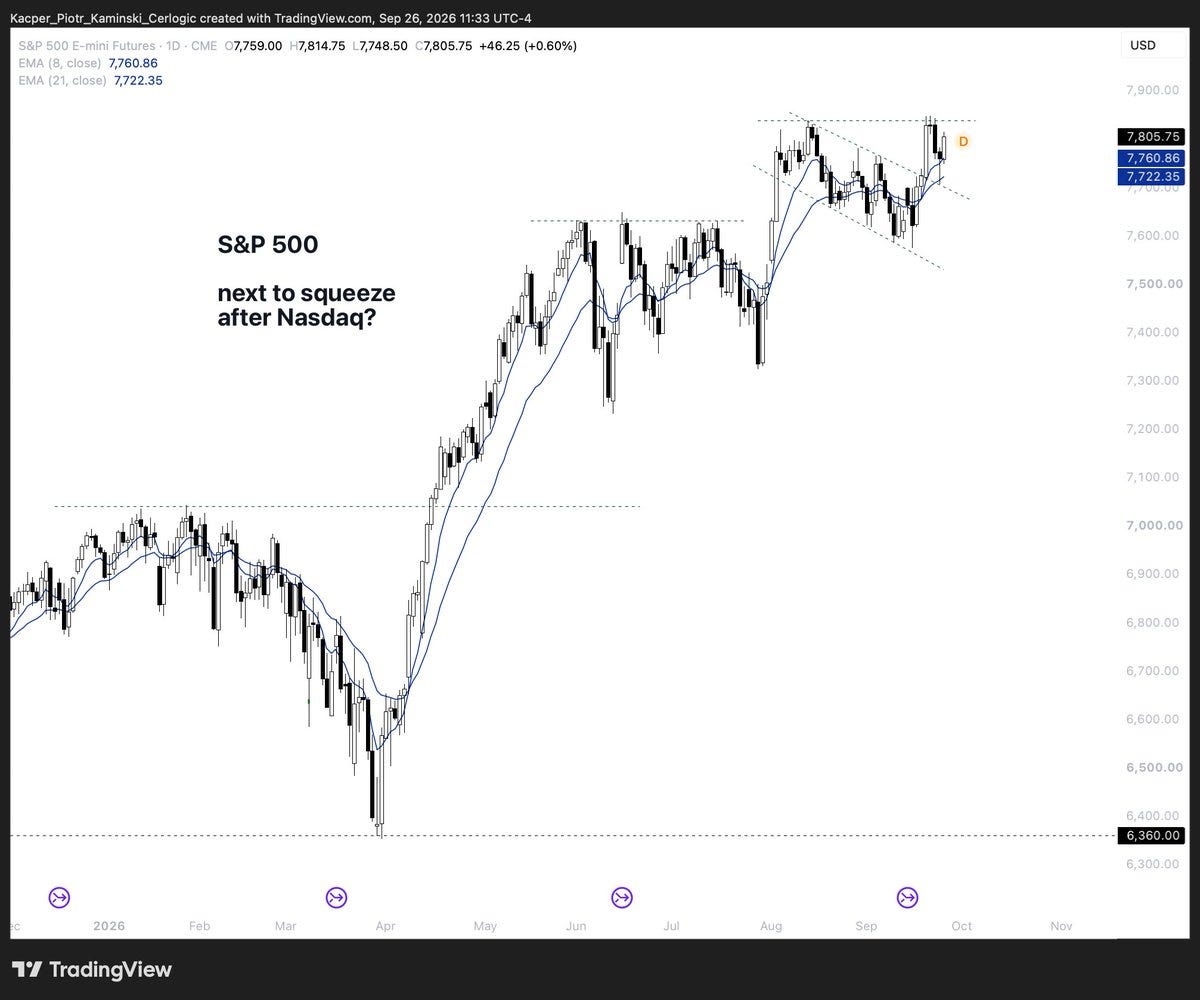
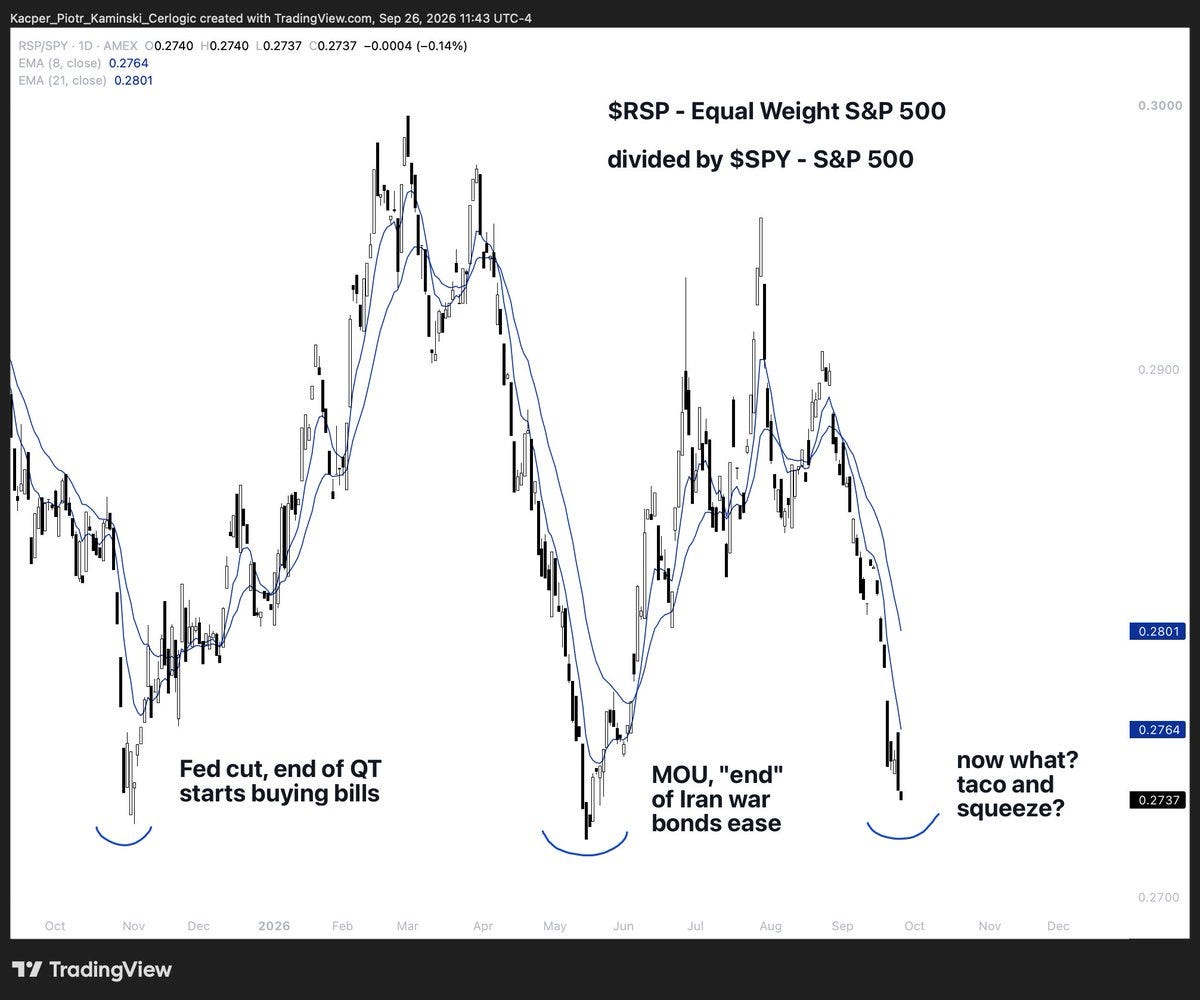
A lot of trends started shifting after the Fed meeting and OpEx week. The squeeze we kept talking about is playing out, first in the Nasdaq, and it may continue. We’ll see if more equal weight driven S&P 500 will be next, might very well be, but it’d require for rates to ease from here.
We don’t predict, we just join where the trend is established.
Still, we don’t just do it blindly, there’s bubble dynamics out there, yields are high, and on top of that we now have quarter-end rebalancing, even outright changes in allocations. We watch, trade, and are ready to turn, fast.
Bubble or not, it’s all about the AI trade, that’s no secret, almost everything is correlated to it. It simply cannot slow down, it’s the economic growth now.
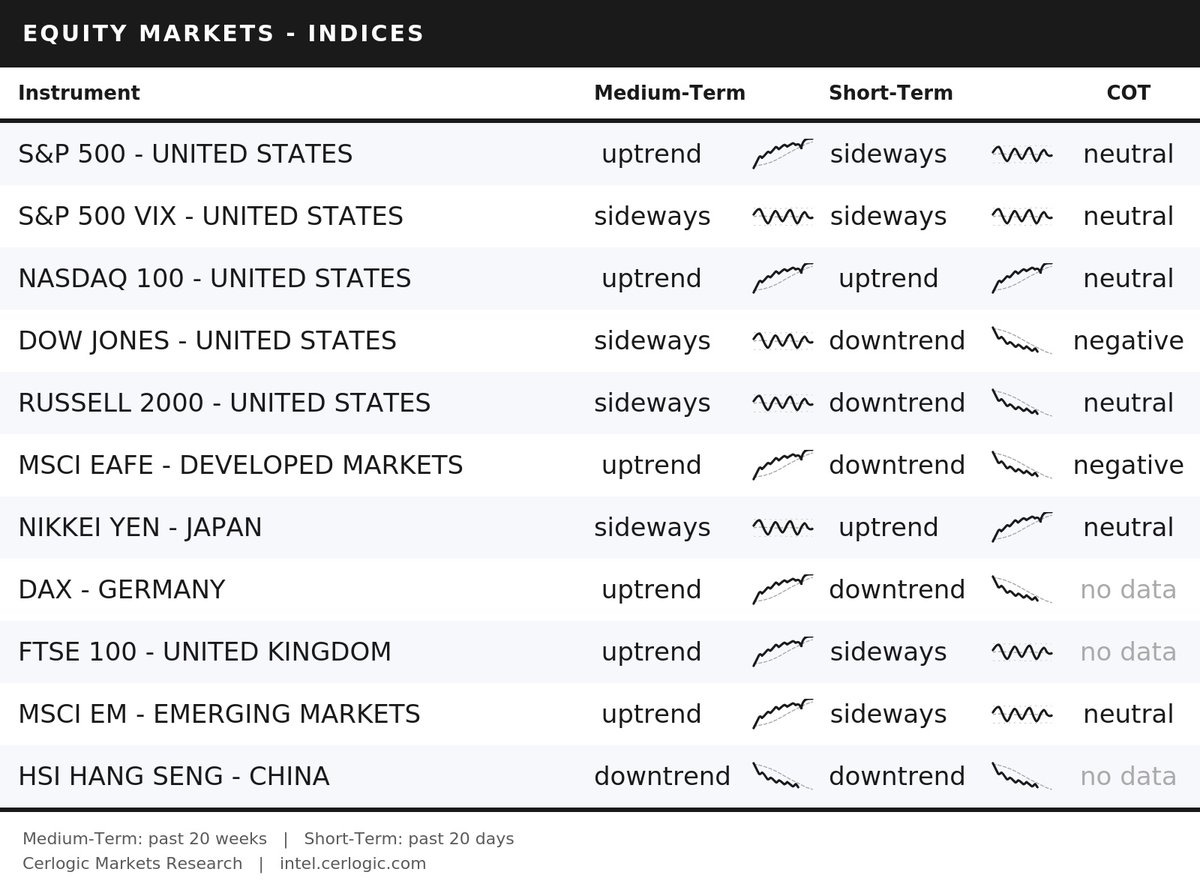
SHORT-TERM TREND CHANGES SINCE LAST WEEK
• NASDAQ 100 – UNITED STATES: sideways ➝ uptrend
• NIKKEI YEN – JAPAN: downtrend ➝ uptrend
MEDIUM-TERM TREND CHANGES SINCE LAST WEEK
• DAX – GERMANY: sideways ➝ uptrend
COT CHANGES SINCE LAST WEEK
• DOW JONES – UNITED STATES: neutral ➝ negative
So, where do we go from here?
We know they’d like to squeeze the markets here, but the question is will they be able to, and for how long. We still don’t assume they can manage the tape forever, it’s the government after all, our friends, no strangers to mistakes or outright failure.
Structurally, none of it changes the general outlook. They’re spending like there’s no tomorrow, social transfers, defense, energy, and maybe now picking up the tab for the private AI sector too.
So, the real question is not whether the global AI race stays on, the question is will it keep being funded by an unbelievable amount of debt. It really depends on the money creation, which is ultimately a policy decision. And money creation just never seems to stop, reinforcing the K-shaped economy, globally.
And then, there is the cycle, inevitably grinding beneath the surface. It’s still pointing to a late phase, yields climbing, equities topping, commodities doing well.
Put it all together and things should start falling into place soon, but getting there will be chaotic and volatile, we think. Patience is often the hardest part, but it’s also necessary. The real money is made at the start of a move, from depressed levels, and I see almost nothing like that out there right now.
So, we’ll keep trading what’s in front of us, there’s always something interesting to do out there in the short term. But when it comes to long-term holds, we’re keeping what’s working, still trending up, but otherwise, we keep the dry powder for the next big opportunity.
CHARTS OF THE WEEK :
FOREX
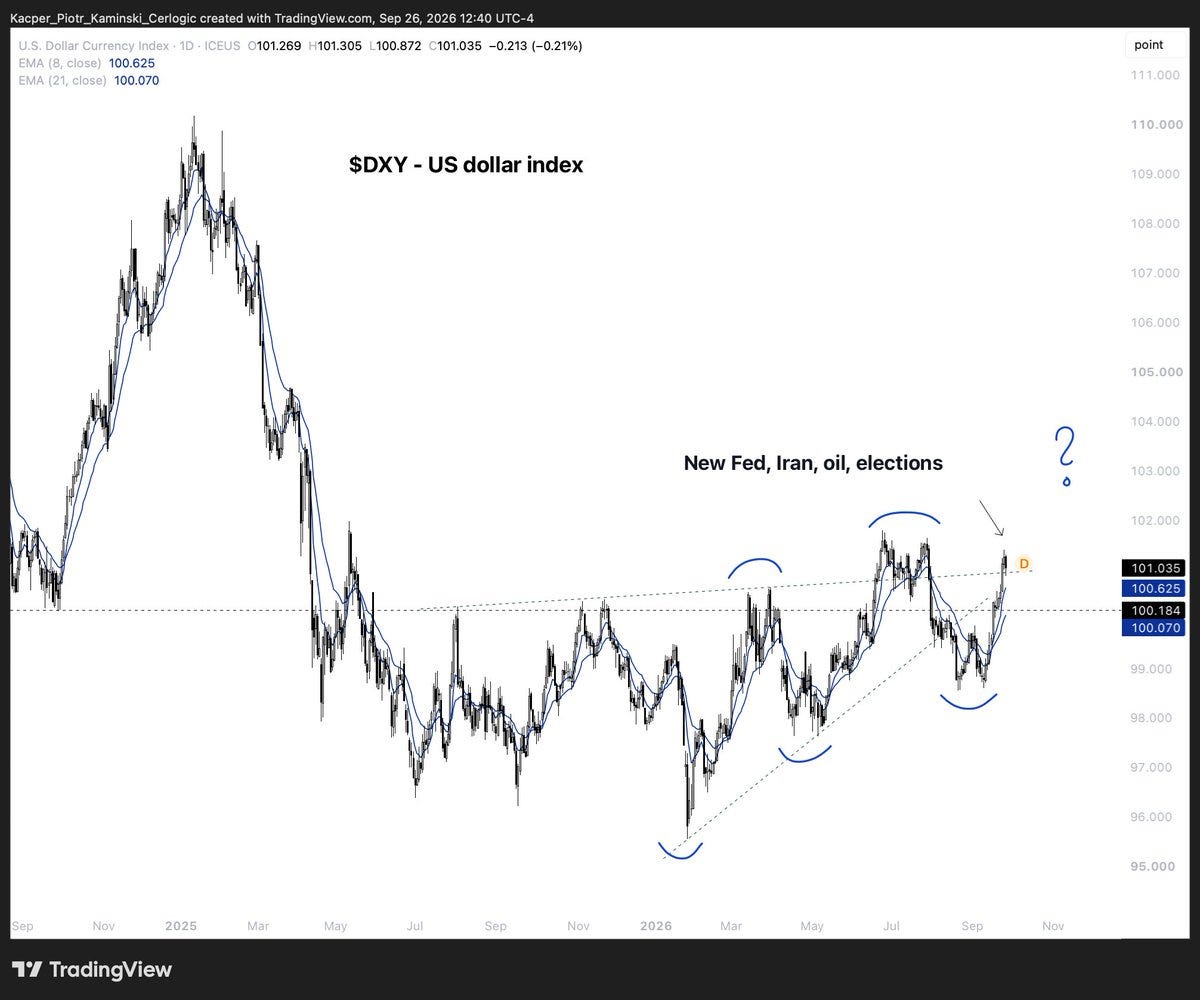
Real run for the dollar, or just the bounce? Last week sure looked real. The DXY didn’t give anything back, and it’s now in both medium and short term uptrend. The piece that didn’t fit is now firmly in place.
Now, will it last? That’s ultimately a political decision now, cause they surely could try to weaken it. War, oil, TGA account, Fed flip .. we’ll just have to see.
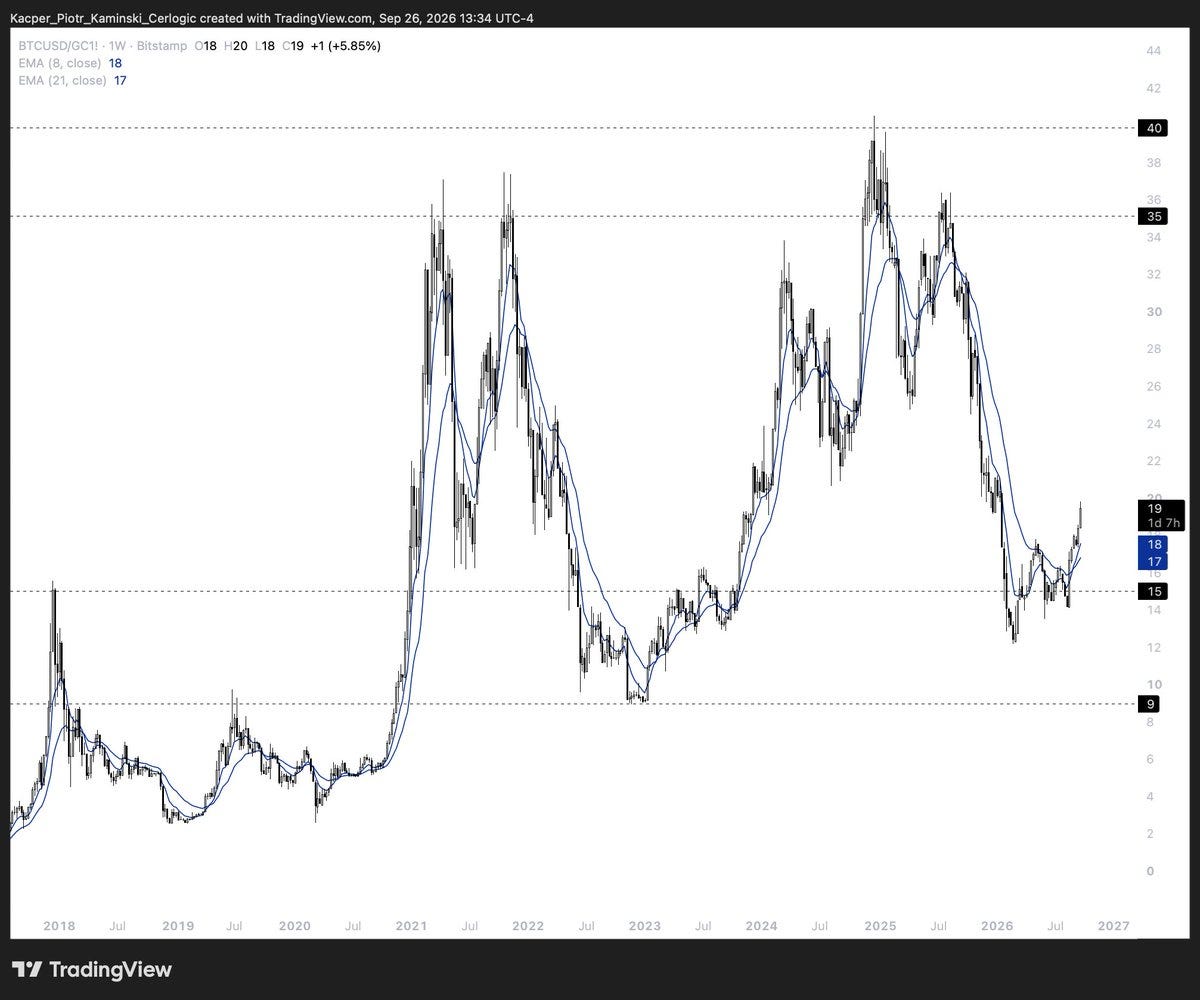
And there’s the give-back we’re watching in gold. No drama though, a pullback due to the stronger dollar was expected. The medium-term picture is intact, and the long-term one is highly supportive.
Bitcoin is back in short-term uptrend here, but it’ll really be interesting to see how it goes against gold, as go to debasement trades in years to come.
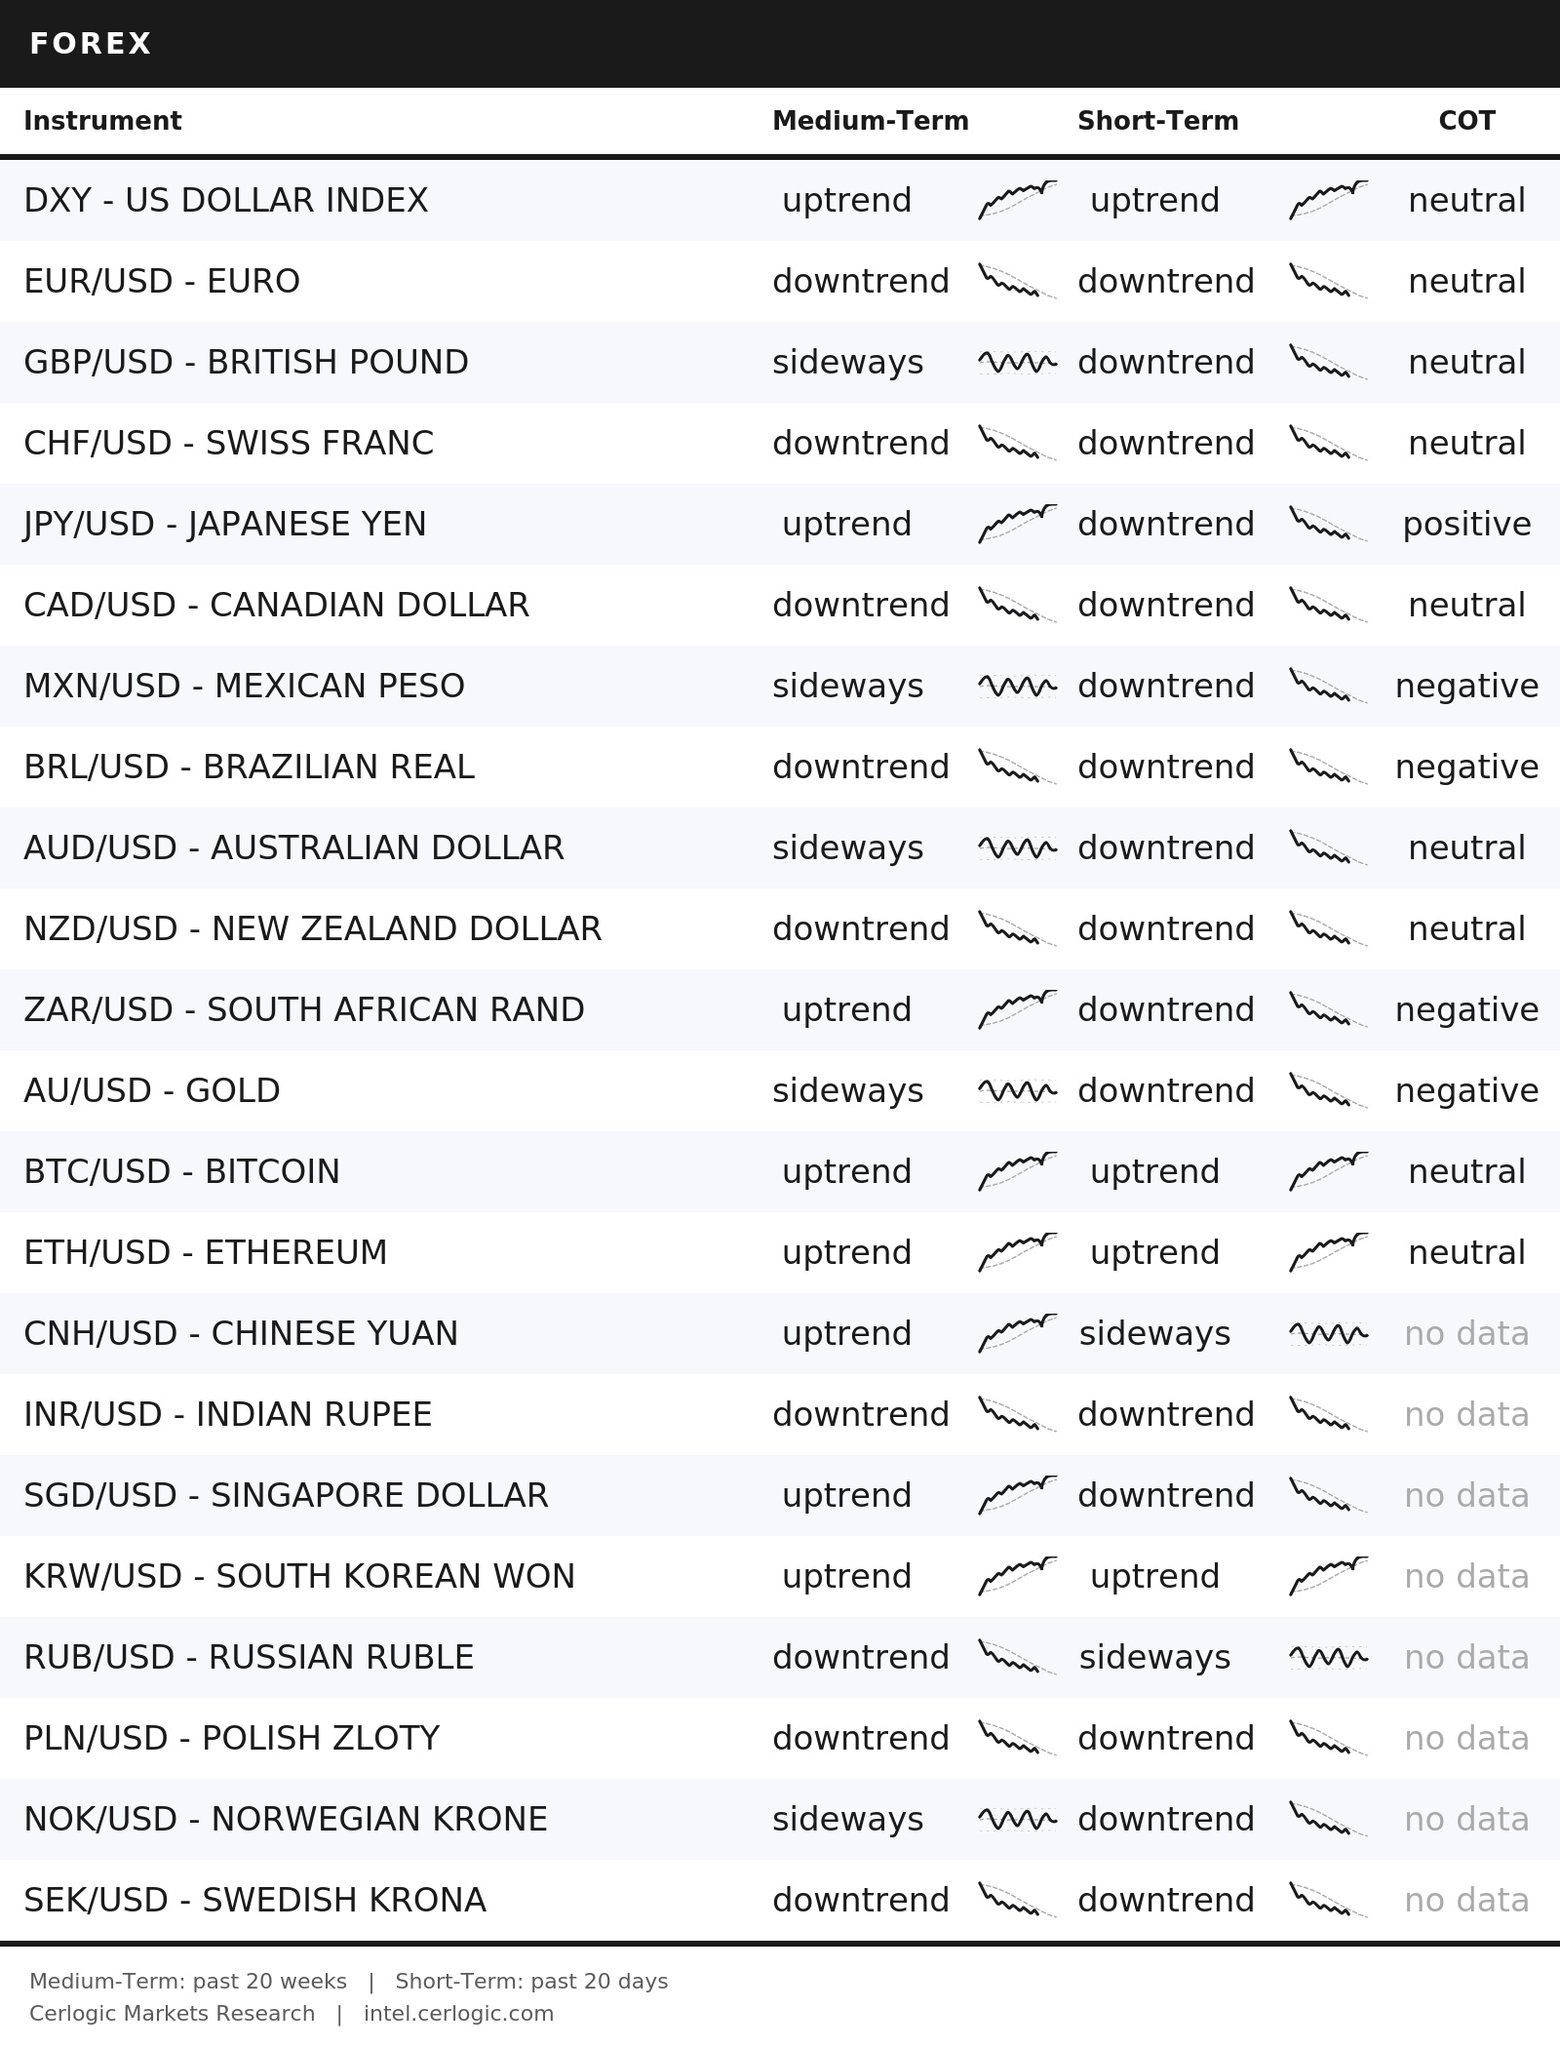
SHORT-TERM TREND CHANGES SINCE LAST WEEK
• JPY/USD – JAPANESE YEN: sideways ➝ downtrend
• BRL/USD – BRAZILIAN REAL: sideways ➝ downtrend
• AU/USD – GOLD: sideways ➝ downtrend
• BTC/USD – BITCOIN: sideways ➝ uptrend
• CNH/USD – CHINESE YUAN: uptrend ➝ sideways
• SGD/USD – SINGAPORE DOLLAR: sideways ➝ downtrend
• KRW/USD – SOUTH KOREAN WON: sideways ➝ uptrend
• NOK/USD – NORWEGIAN KRONE: sideways ➝ downtrend
MEDIUM-TERM TREND CHANGES SINCE LAST WEEK
• DXY – US DOLLAR INDEX: sideways ➝ uptrend
• EUR/USD – EURO: sideways ➝ downtrend
• CAD/USD – CANADIAN DOLLAR: sideways ➝ downtrend
• MXN/USD – MEXICAN PESO: uptrend ➝ sideways
• BRL/USD – BRAZILIAN REAL: sideways ➝ downtrend
• AUD/USD – AUSTRALIAN DOLLAR: uptrend ➝ sideways
• NOK/USD – NORWEGIAN KRONE: uptrend ➝ sideways
COT CHANGES SINCE LAST WEEK
• JPY/USD – JAPANESE YEN: neutral ➝ positive
• MXN/USD – MEXICAN PESO: neutral ➝ negative
• BRL/USD – BRAZILIAN REAL: neutral ➝ negative
• AU/USD – GOLD: neutral ➝ negative
CHARTS OF THE WEEK :
INDUSTRIAL METALS
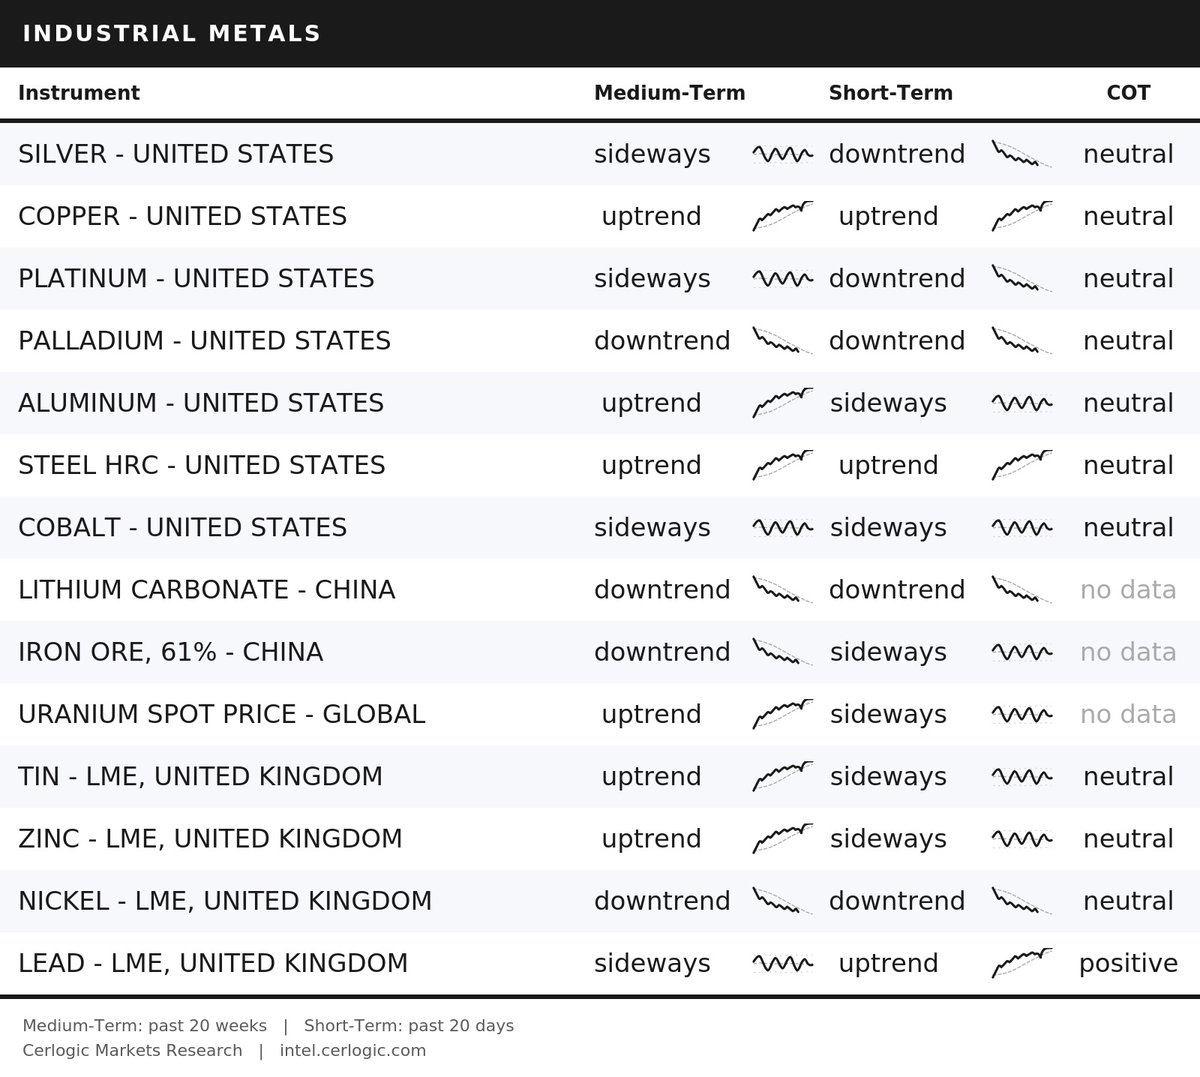
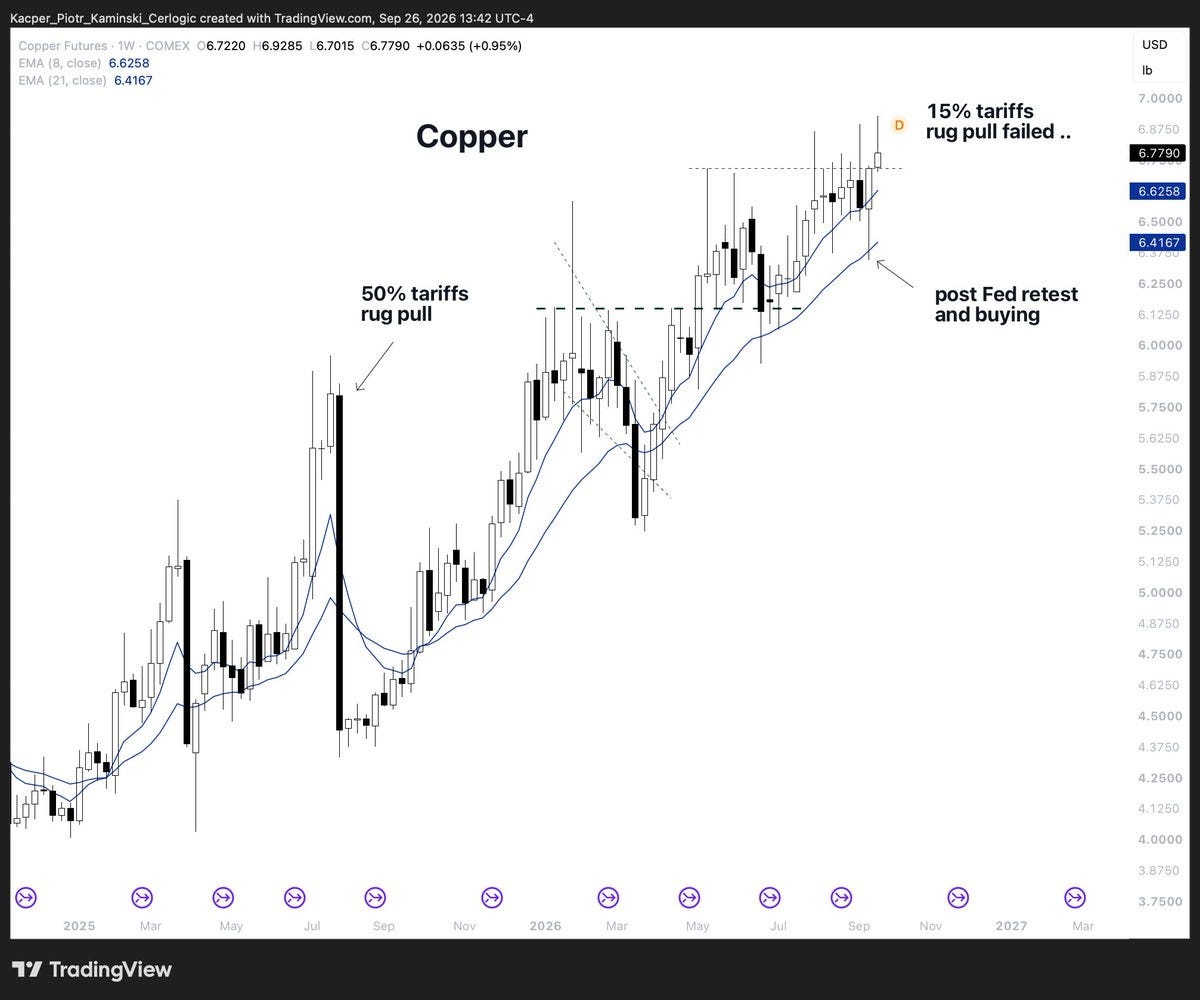
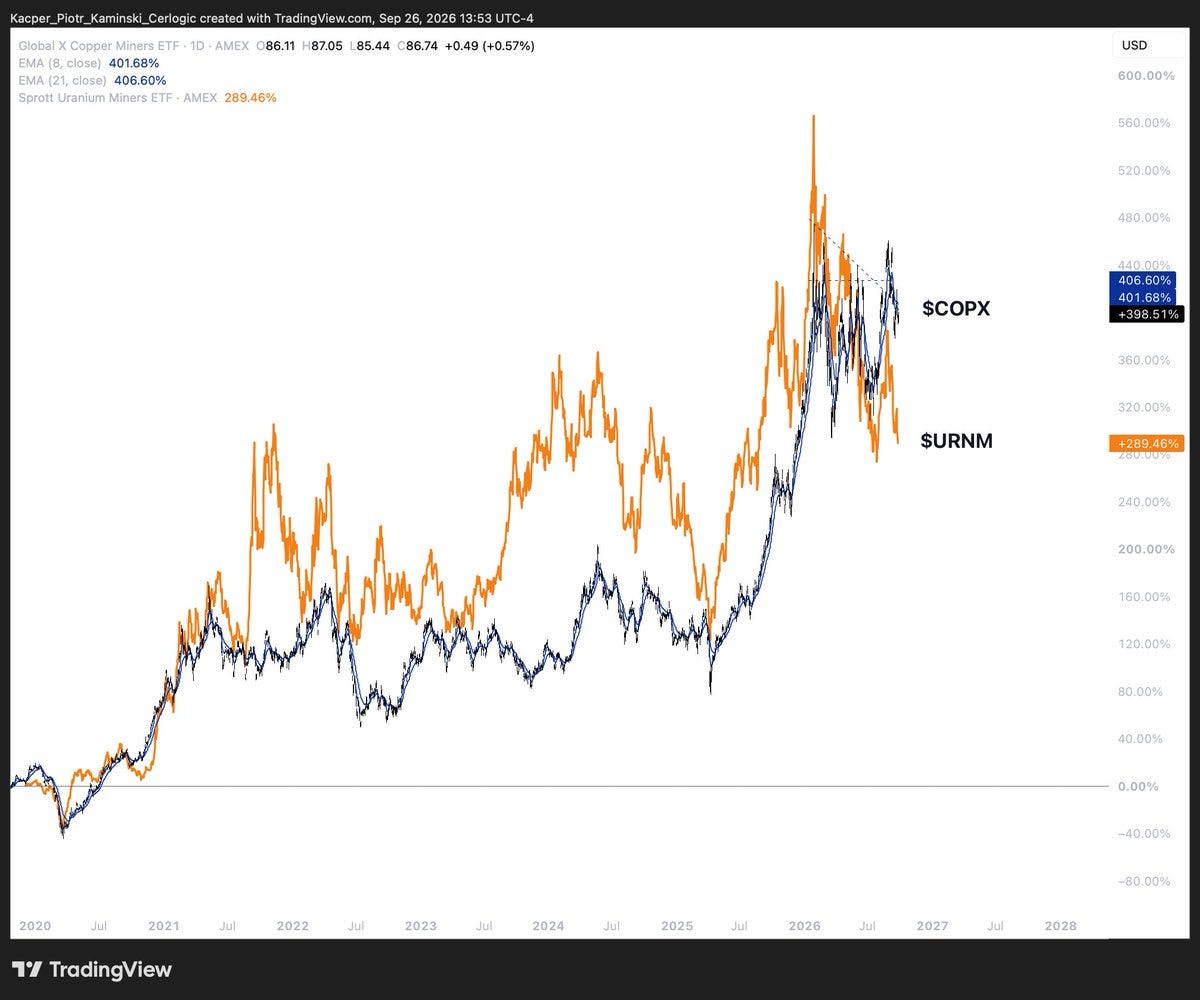
Copper is back, still the king, relative outperformance is quite striking. Short-term uptrend again, the 15% tariffs rug pull well and truly failed.
Some of the other base metals are doing okay too, especially on the industrial side: aluminum, uranium, tin, zinc, especially given the recent move in rates and the high oil/energy crisis hitting the global economy.
The precious side is feeling the pressure, and where we go from here is still largely a political question, same as pretty much every week since March.
In the short term, anything can happen. We stay flexible, keep what is working and cut what is not.
SHORT-TERM TREND CHANGES SINCE LAST WEEK
• SILVER – UNITED STATES: sideways ➝ downtrend
• COPPER – UNITED STATES: sideways ➝ uptrend
• PLATINUM – UNITED STATES: sideways ➝ downtrend
• URANIUM SPOT PRICE – GLOBAL: uptrend ➝ sideways
• TIN – LME, UNITED KINGDOM: downtrend ➝ sideways
• LEAD – LME, UNITED KINGDOM: sideways ➝ uptrend
MEDIUM-TERM TREND CHANGES SINCE LAST WEEK
• PALLADIUM – UNITED STATES: sideways ➝ downtrend
• TIN – LME, UNITED KINGDOM: sideways ➝ uptrend
COT CHANGES SINCE LAST WEEK
• TIN – LME, UNITED KINGDOM: negative ➝ neutral
• LEAD – LME, UNITED KINGDOM: neutral ➝ positive
CHARTS OF THE WEEK :
ENERGIES
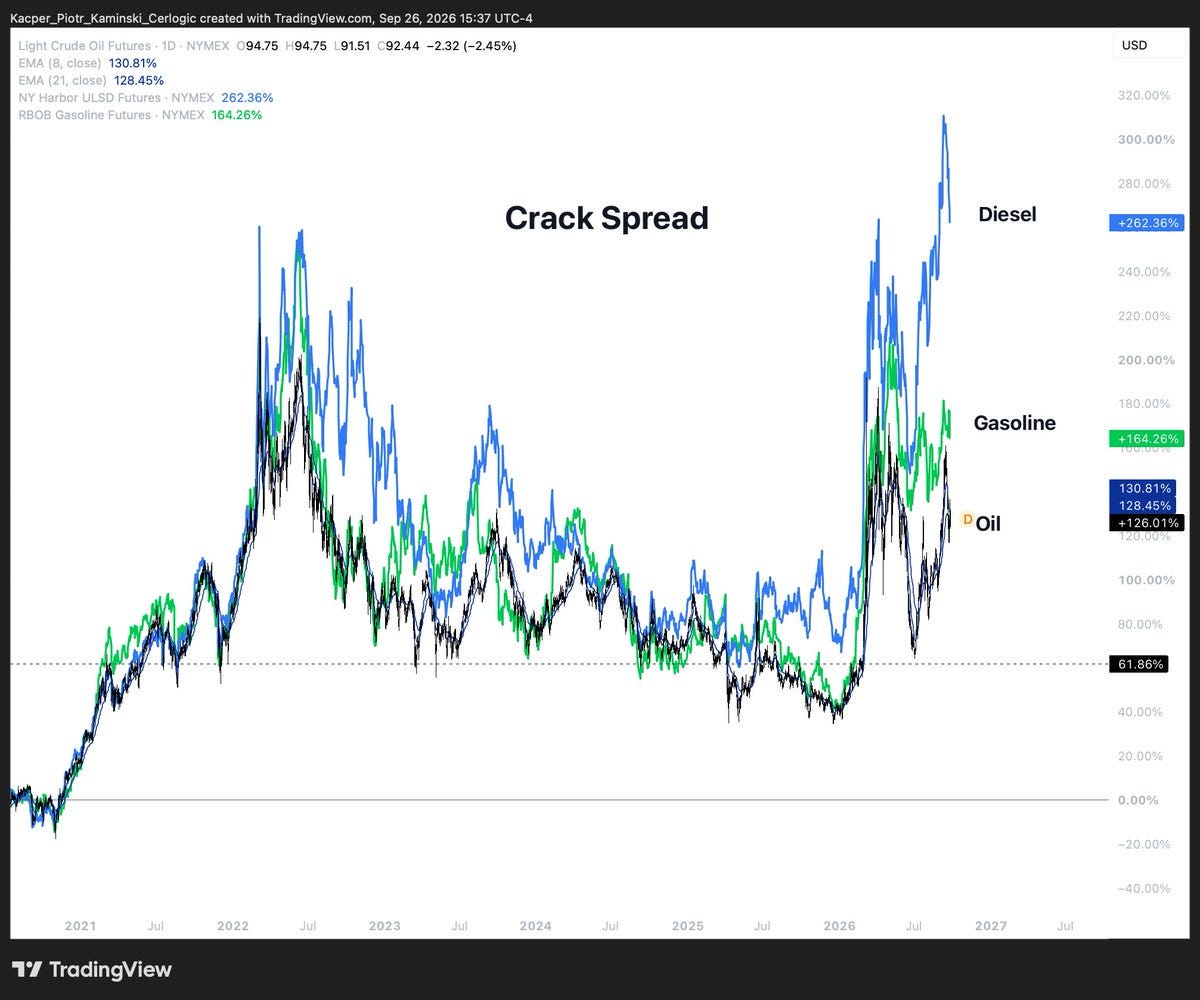
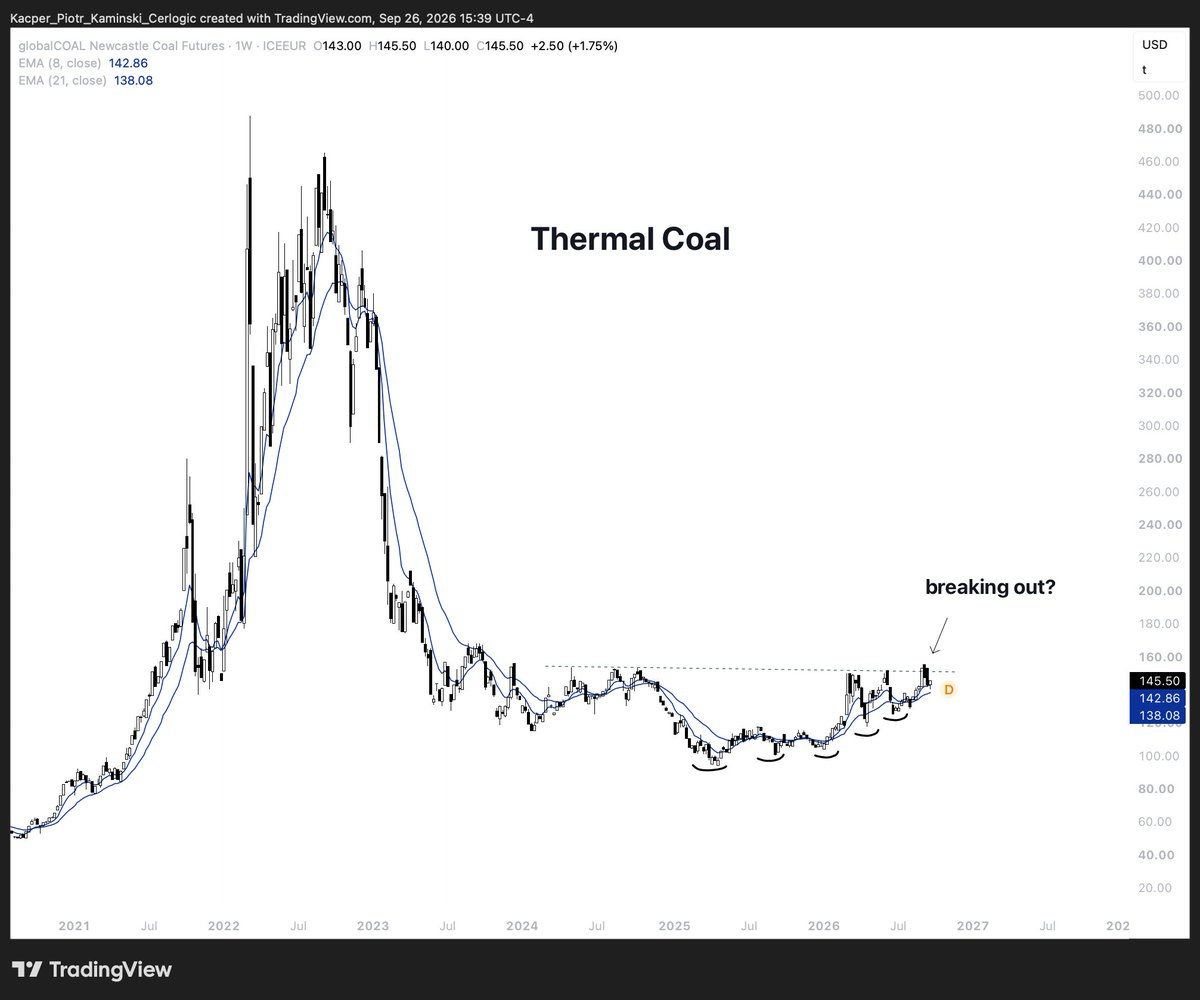
The oil complex took a breather last week. Headlines dominated. Crude, diesel and gasoline, all eased after the recent strong run.
Short-term direction remains dependent on the political decisions, same as every week since the war started. The Middle East, the Houthis and the Saudis, still Russia.
The incentives are to announce some sort of success, but I won’t pretend to know what they’ll. After that, it doesn’t look like it’ll be over anytime soon.
What we can do is stick to facts. The damage to production capacity and the depletion of reserves is done, and it’ll be with us for years, likely extending right into what would anyway be an underinvestment crisis, the one set to bite by the end of this decade.
Easy money has been made, but there are a lot of opportunities here for patient and strategic investors, upstream, midstream, downstream, services, you name it, and we’re ready for it. Our core long-term energy equity positions stay on, they are just hedged for the moment.
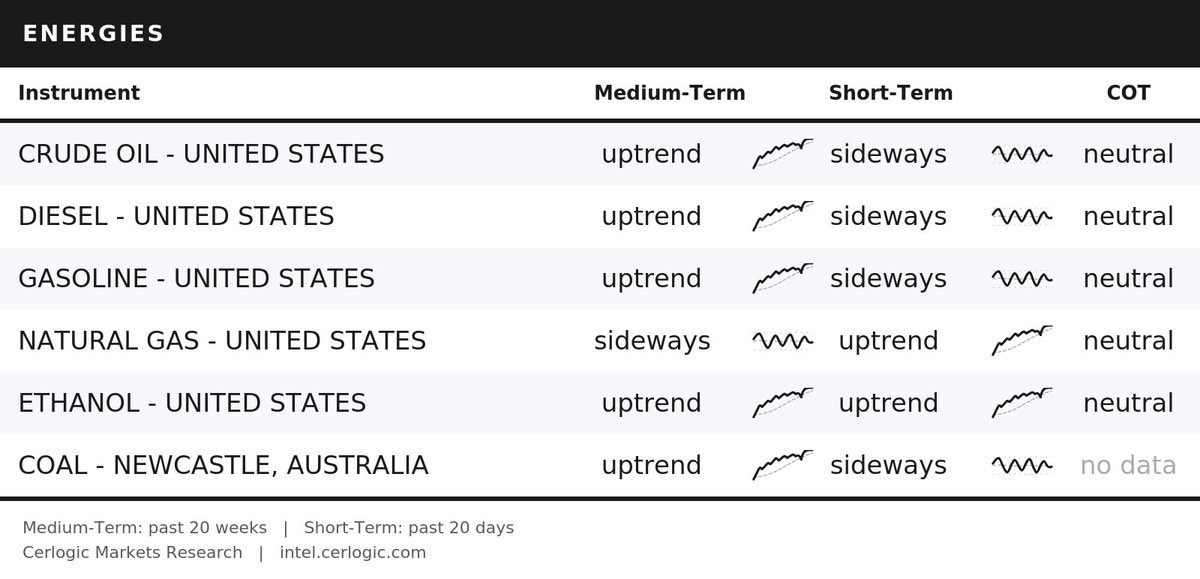
SHORT-TERM TREND CHANGES SINCE LAST WEEK
• CRUDE OIL – UNITED STATES: uptrend ➝ sideways
• DIESEL – UNITED STATES: uptrend ➝ sideways
• GASOLINE – UNITED STATES: uptrend ➝ sideways
• NATURAL GAS – UNITED STATES: sideways ➝ uptrend
MEDIUM-TERM TREND CHANGES SINCE LAST WEEK
• NATURAL GAS – UNITED STATES: downtrend ➝ sideways
COT CHANGES SINCE LAST WEEK
• NONE
CHARTS OF THE WEEK :
TREASURIES
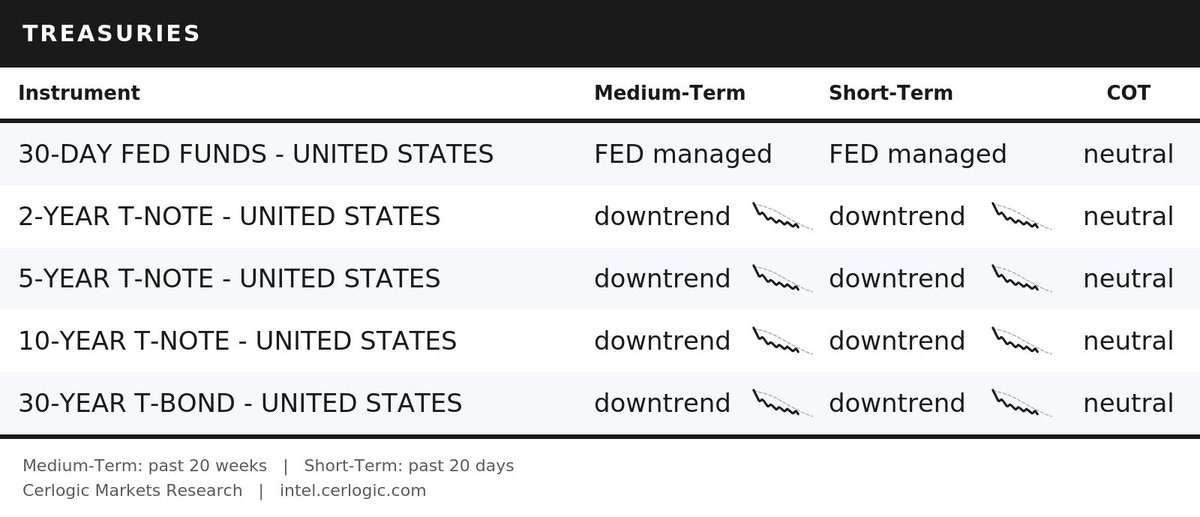
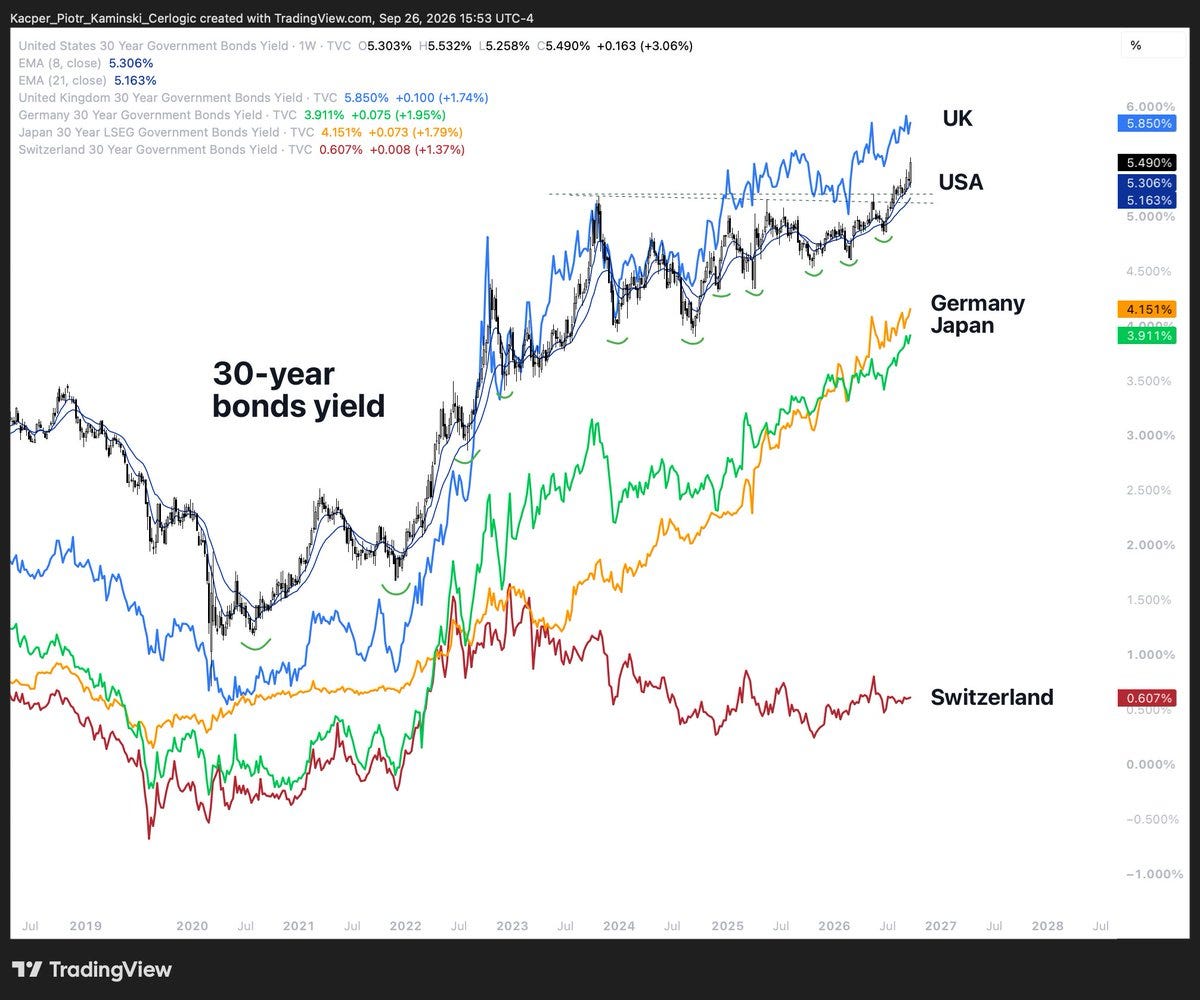
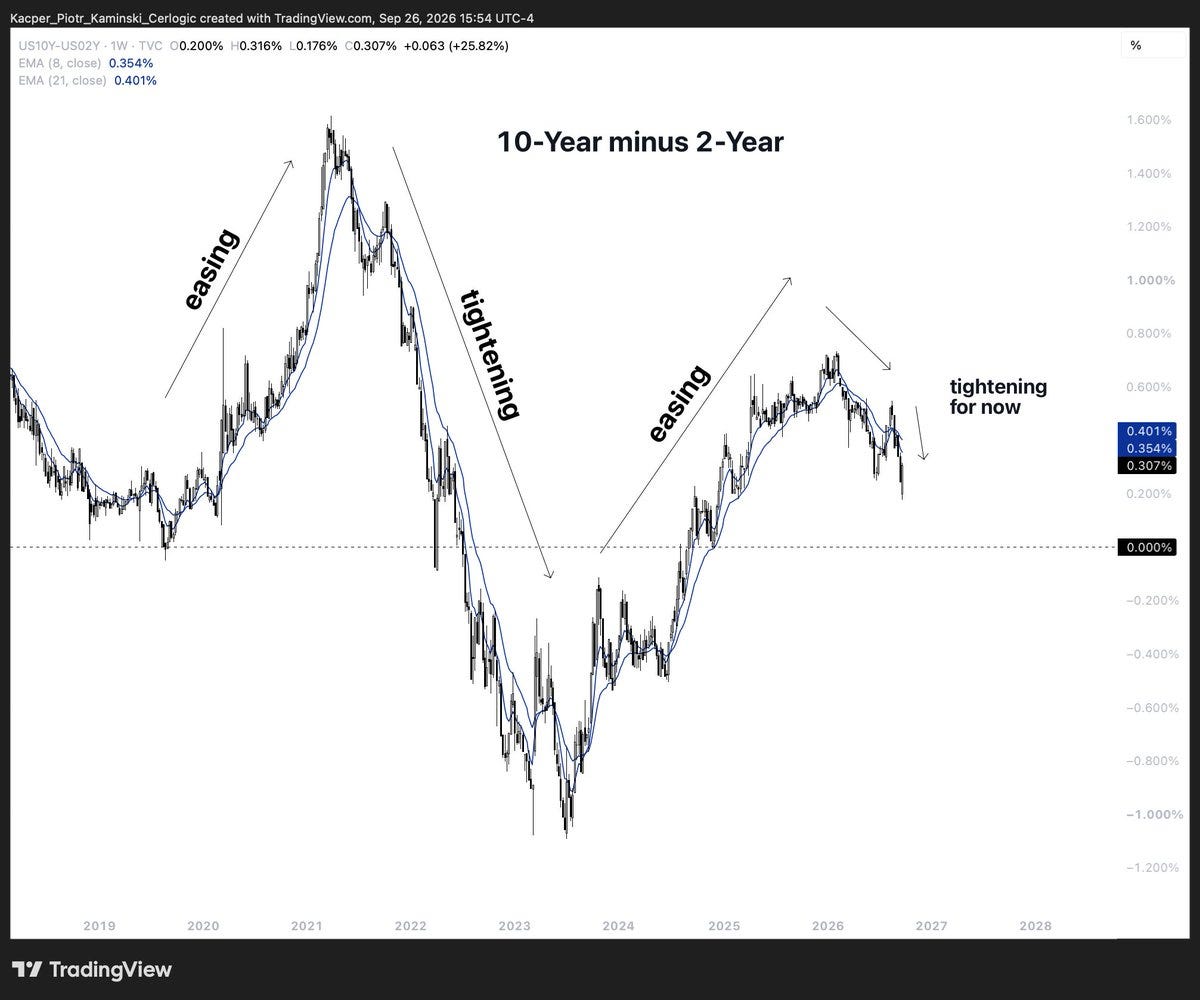
Like we said, beatings will continue until morale improves, week three of outright crash, the whole curve still in a downtrend.
The Fed hike came and went and the long end couldn’t care less.
The path was clear, as long as the energy crisis stayed unresolved, kept writing about it since the war started. The pace is unusual, the levels are not, historically at least.
Now, if they reach some kind of arrangement, we’ll likely see a pause. But it has to be real, and it has to hold, at least for a longer while.
If there’s no deal, then oil and yields will find a way to cause a global slowdown on their own. Where exactly is that breaking point? We’ll see.
As to interventions, bond markets are simply too large to be moved that easily. It may take trillions, like in 2020.
Nothing structural has changed, more deficits, more issuance, more money supply. We still take no longs here.
SHORT-TERM TREND CHANGES SINCE LAST WEEK
• NONE
MEDIUM-TERM TREND CHANGES SINCE LAST WEEK
• NONE
COT CHANGES SINCE LAST WEEK
• NONE
CHARTS OF THE WEEK :
AGRICULTURE
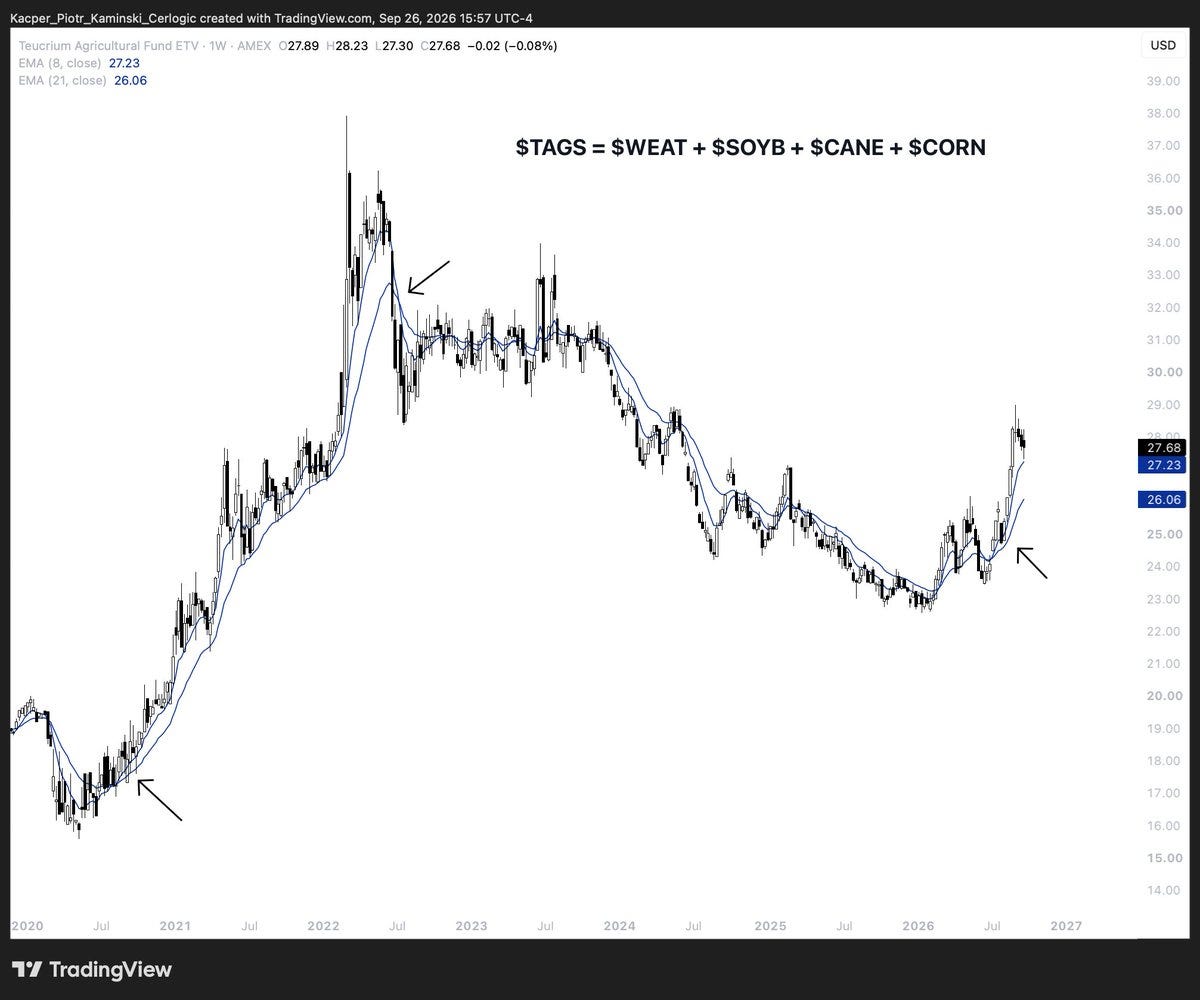
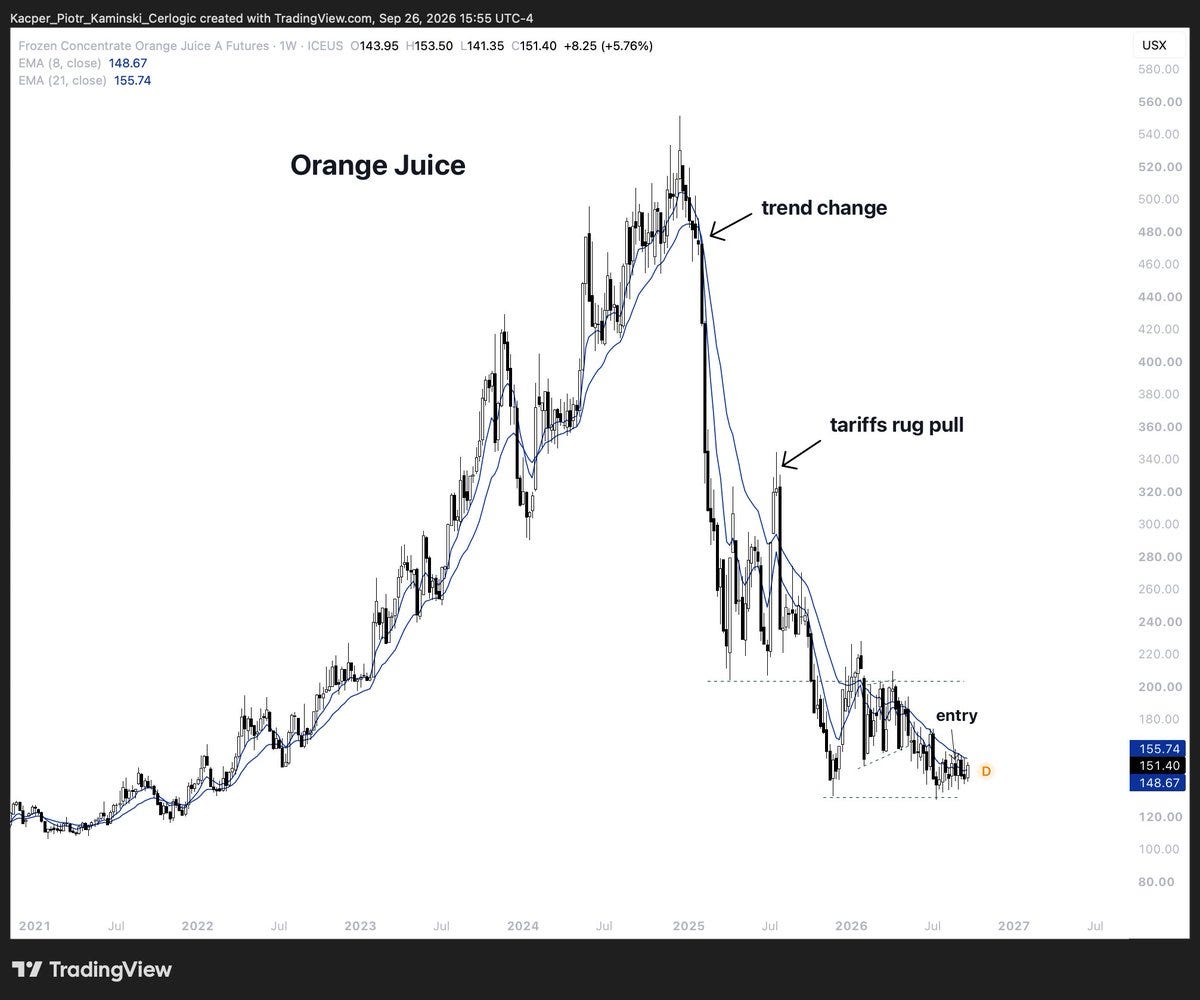
Same as always, sharp moves to new highs then violent pullbacks to higher lows, usually driven by headline, it’s just how they behave now.
Two ways to play it, swing the individual commodities short-term, or hold long-term and take the good with the bad of the bull run. Both depend on the trader’s psychology.
The bigger picture stays the same, and it points up. The fertilizer and energy damage is done, and El Niño is still out there. We stay long where the trends hold, and let the prices move as far as necessary to incentivize production.
The crush spread setup we’ve got our eye on is moving now, way ahead of our 2027 base case, we won’t complain, it’s working.
And on fertilizer equities, they typically move well into an ags bull market. Farmers need the money to buy them, so they need to sell their production at high prices into the future.
Right now they’re struggling, fuel prices through the roof, and it’s usually right here that governments step in, subsidies, tax breaks, that’s the tell, it’s where the fertilizer cycle begins.
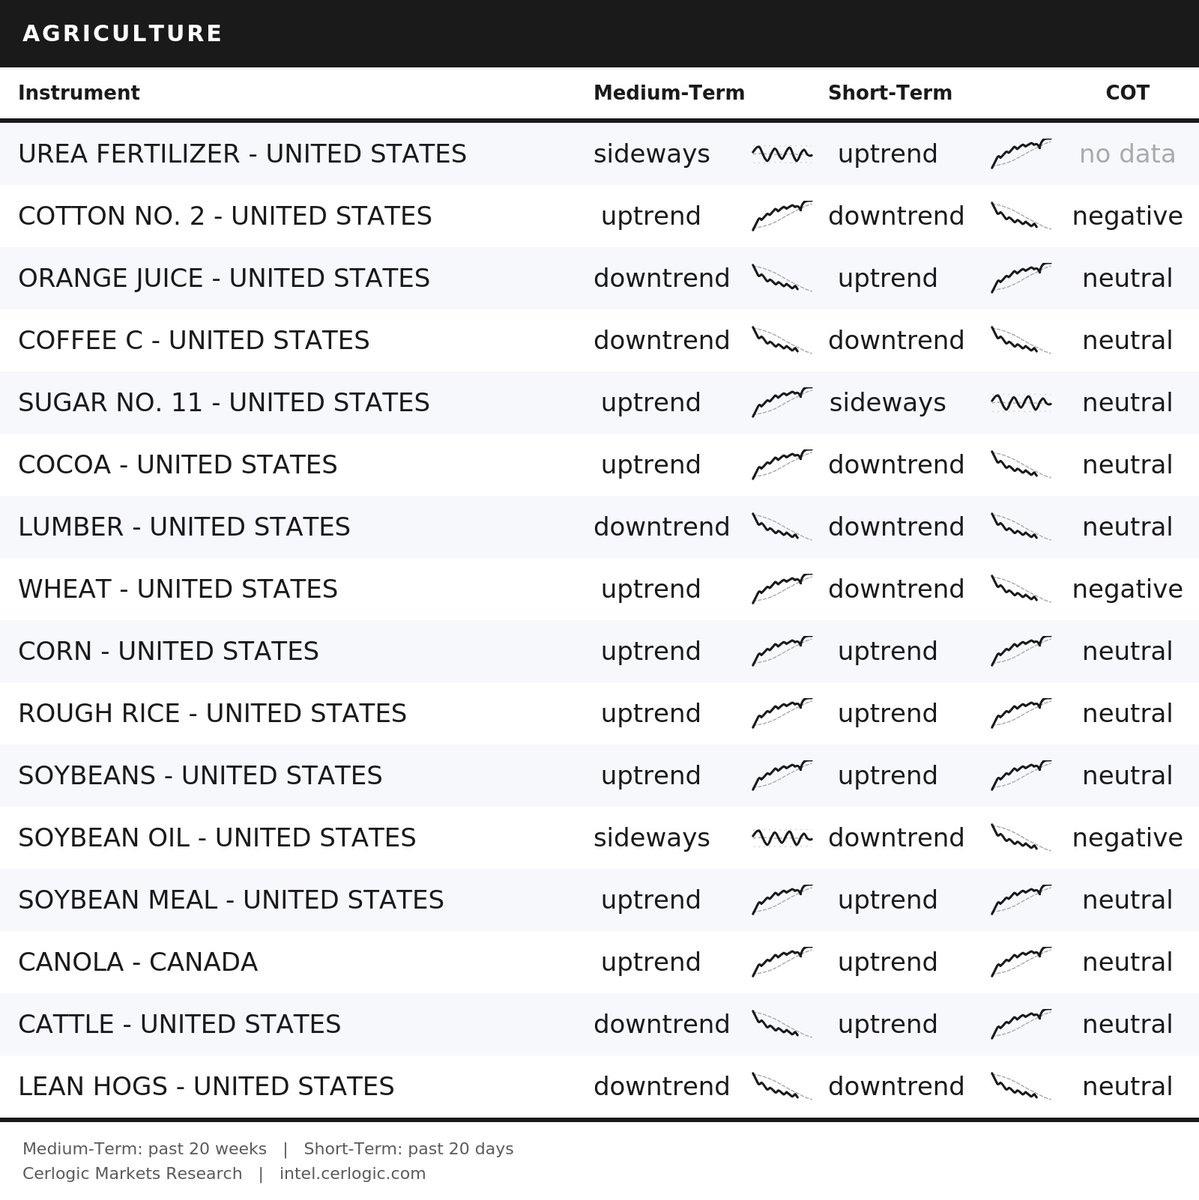
SHORT-TERM TREND CHANGES SINCE LAST WEEK
• ORANGE JUICE – UNITED STATES: downtrend ➝ uptrend
• WHEAT – UNITED STATES: sideways ➝ downtrend
• SOYBEAN OIL – UNITED STATES: sideways ➝ downtrend
• CATTLE – UNITED STATES: sideways ➝ uptrend
MEDIUM-TERM TREND CHANGES SINCE LAST WEEK
• UREA FERTILIZER – UNITED STATES: downtrend ➝ sideways
• COFFEE C – UNITED STATES: sideways ➝ downtrend
COT CHANGES SINCE LAST WEEK
• COFFEE C – UNITED STATES: negative ➝ neutral
• WHEAT – UNITED STATES: neutral ➝ negative
• SOYBEAN OIL – UNITED STATES: neutral ➝ negative
CHARTS OF THE WEEK :
That’s it for now. Stay safe out there!
Kacper Piotr Kaminski, Cerlogic Markets Research – intel.cerlogic.com
This publication is for informational and educational purposes only and does not constitute investment advice. Markets involve risk, and every participant is responsible for their own decisions.